[Do you like this? Please subscribe to my YouTube Channel and then share it for me!]
Video Summary
If you’ve ever wondered how your website is performing on the internet, you’re not alone.
In the previous video I gave you 7 benefits of tracking your keyword rankings. Then I gave you a quick and easy way to monitor your google keyword rankings.
But today, I want to get hands-on with the Google Search Console as a tool to quickly get some detailed information about your keyword rankings.
For any website that has been around a while, especially if you focus on more than just a handful of keyword phrases, using this tool from Google is quite beneficial. And it’s totally free, so the price is right too! Let’s start…
Video Transcript
Hello, Jeffrey Kirk here.
In the previous video I gave you 7 benefits of tracking your keyword rankings. Then I gave you a quick and easy way to monitor your google keyword rankings. In case you haven’t seen that video yet, I put the link here. It has some good background info that could be helpful to you, so take a look.
But today, I want to get hands-on with the Google Search Console as a tool to quickly get some detailed information about your keyword rankings.
For any website that has been around a while, especially if you focus on more than just a handful of keyword phrases, using this tool from Google is quite beneficial. And it’s totally free, so the price is right too!
If you don’t remember the URL to get to the search console, no problem, just do a quick search for the words “Google Search Console” and click on it.
For this video, I assume you already have your Google Search Console set up. If not, just watch what I’m doing here. I think it will convince you that setting up the search console is a good idea.
Okay, I’m going to go to my computer so I can show you what to do once you have data in your search console account.
Google Search Console
Okay, so here I just did a search for Google Search Console and I will click on the link and then click start now. My account’s already logged in, so I get data right away. And so I’m looking at the data for chocolate university online.com.
The place to begin is come over here to Performance and click on Search Results. Initially what you’re going to notice first is this graph that’s right here, and it is already set for total clicks and total impressions.
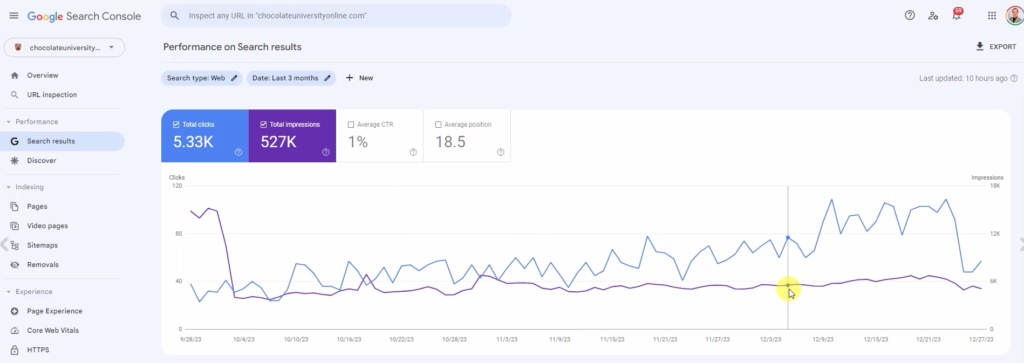
So total clicks is in blue and total impressions is in purple. So we can see how these relate to each other. And you can see as I’m moving along each day I get a new total of impressions. Right now on November 27th, I’m seeing 5,544 impressions, which means that’s how many times this website showed up in the search results. And out of that 55 times it got clicked.
So basically 1% of the impressions got a click. The other thing you see up here is average click-through rate 1%, which is the number that happened that day that I just showed you, but it looks like that’s the number that happens over time.
And the average position 18.5, well 18.5 is pretty far down in the search results, so that’s probably why the click-through rate is just 1% because the average is pretty low down, but we’re going to drill in deeper.
So let’s take a look. Let’s look at Average Position. I’m going to add it to the graph by clicking on this and we can see now when we hover over it that the average position on October 31st was 15.6.
Let’s go back to that November 27. The average position was 17.3. We can watch that average position over time, but what’s going to make even more sense is individual keywords.
You want to scroll down to the data below. So this table down here, it’s currently set for queries. What that means is we’re going to see what phrases people are searching for in Google and how they appear.
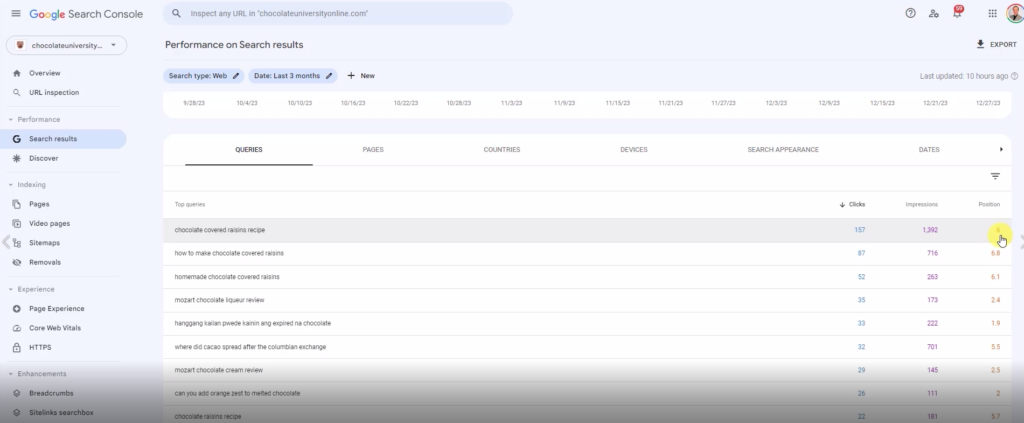
The top one chocolate covered raisins recipe, it averages in the sixth position. That’s a whole lot better than 17 and a half or 18 as the average position. And you can even see down here there’s some, can you add orange zest to melted chocolate? Somebody does that search. It shows up in the number two position.
So we can see how each keyword is reacting separately. But let’s take a look at this top one. So it’s in the sixth position. It has shown up in 1,392 impressions and got 157 clicks. So that 1 57, that’s more than 10%. That’s doing pretty good. And what I can do with this is click on that and now we’ll get the graphs just for that data.
Now you can see the impressions again, still purple. So let’s take that November 27th date. And you can see the average position was 5.2. We got nine impressions and two clicks. About 22% of the impressions got clicked that day.
The other interesting thing is you can see this average position graph is going up at the beginning of this graph. So late September, the average position was 9.3. Now at the end of the graph, we’re at a position of 3.2. So this particular result has been improving very nicely over the past three months.
What I can also see on here is how it’s dropped off the last few days. We reached our peak right before Christmas on December 22nd, our average position was four, which is the best it had been prior to this. The number of impressions, 67 and the number of clicks nine. And then look what happens the next day.
The number of impressions drops as does the number of clicks. And by a couple days, by Christmas day, the position hasn’t changed too much, but the number of impressions and clicks have dropped considerably.
So what does that tell me? It just says that nobody’s looking for that on Christmas Day. You can see it’s rebounded a little bit since, our average position at 3.2 is the best it’s ever been, the number of impressions and clicks are still way down though.
So it’s not that our results got worse, our position has actually improved, but the number of people searching has gone down because the number of impressions is lower. The position stayed good and the impression dropped that lets us know that fewer people are searching. And yet the number of click throughs is 25%. So three out of 12 is 25% are clicking through, which is pretty good. So I’m happy with that.
What else can we do here? Up here the date shows as the last three months. I can click this and let’s say we just wanted to look at the last 28 days. I could click that and hit apply and it’ll just show the last four weeks worth of data.
Or if I come here, I could say, well, let’s look at the last year and see how things look. Did we get the same kind of spike last year around Christmas time? We’re seeing the after effects of it. 12 months isn’t quite enough, but look how it’s been all along.
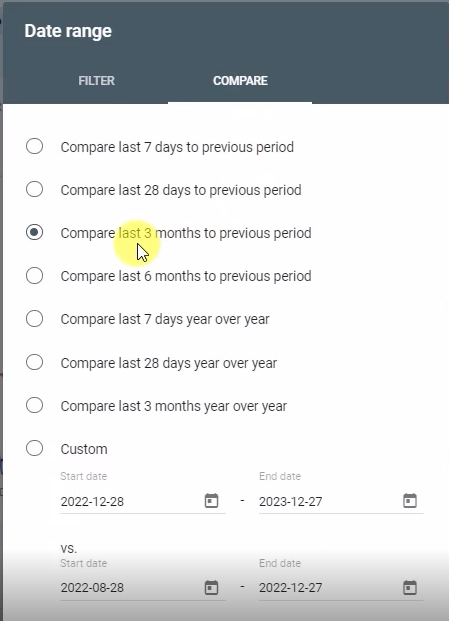
So we’re still considerably higher than it was a year ago. Look at the average position back here, 17, 18 or so. We’ve really improved this a lot over the last year. You can also compare, so instead of being on the filter tab, I can go to the comparison tab and let’s look at these three months to the prior three months.
The solid lines are the current three months. These would be the ones we saw previously. And then the dash lines are the prior three month period. So we can see how everything has improved over this three month period.
And you can scroll down here to the data and see the comparison. In the previous three months, there were 15 clicks in the last three months, 157. So we’re getting 10 times the clicks and it shows us the difference, the number of impressions in the last three months compared to the previous three months, the difference in impressions. And then the same thing with the average position.
The last three months average was 6, prior 10.4, and we improved by 4.3. So that’s what I wanted to show you here. If you want to export this data into an Excel spreadsheet, you can just come up to Export.
There’s not much if you’re on this page because it’s just going to show you the one line of data. But if we were to go back and get all the data, we can just come over here, remove our query. So this’ll take us back to showing the entire table, still comparing the three months, and we could export and then we’ll see everything.
If we didn’t want that comparison, we’d just come back here to compare, turn it back to the regular filter, go back to three months, and we’re just back to our first set of data. In which case if we hit export at this point in time, then we’re going to see an Excel spreadsheet that contains all of these queries and all of this data.
You can see there is a lot of good data, a lot we can learn just by looking at these graphs and the words that show up here. So, as you could see, Google Search Console is quite powerful, much more efficient than the manual method. And I only showed you a small part of what you can do with this tool.
Keep in mind though, that there are some limitations. For example, you can only track specific keywords that Google wants to show you in the search console list. Unfortunately, that means you can’t set up tracking for custom keywords.
But, for a quick and budget-friendly overview of your site’s performance, it’s hard to beat.
So How Often Should You Check Your Keyword Rankings?
Don’t make checking your rankings a daily workout unless you’re recovering from a Google penalty, or Google just dropped a major algorithm update.
In most cases, checking once a month is okay. If you’re in an industry or profession with fierce competition, you can check more frequently, maybe you’ll want to check in weekly instead of monthly.
Monitoring your Google Keyword rankings doesn’t have to be a daunting task. With the right tools, a bit of curiosity, and patience, you’ll gain a good understanding of how your website is behaving in the search results.
Also, by applying these tips and continually improving your site, you’ll get better performance, which leads to better user experiences and more traffic.
Now, if you didn’t take advantage of my offer in part one, it’s still available and it’s still free. I put together a Local SEO Strategies Checklist for you which you can get at upatdawn.biz/10local. You’ll see 10 strategies on the checklist, and each one has 3 action steps you can take. Go ahead and get that now.
I would also appreciate it if you like this video and subscribe to my channel.
Your business deserves to be seen online, and I will help you get there.
Thanks for watching and have a great day!