
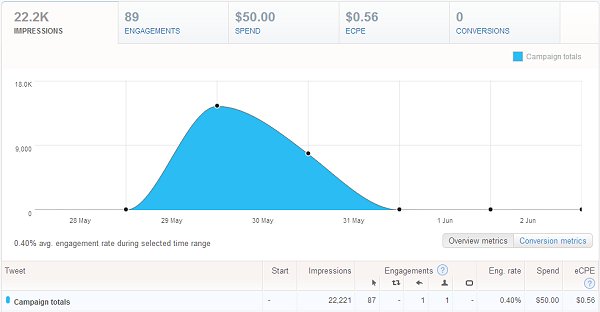
Let’s take a look at the results of the Twitter Ad campaign. (If you missed the first post, start here and then come back.)
This is Why Split Testing is Important
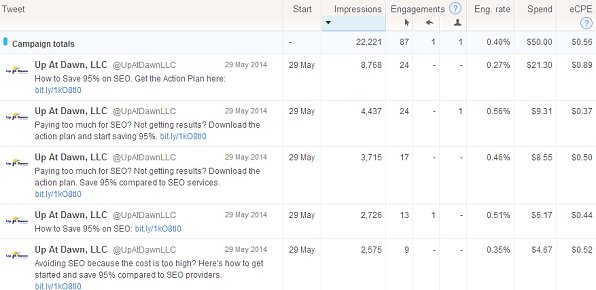
It turns out that ad #2 had the highest engagement rate at 0.56%. That ad was “Paying too much for SEO? Not getting results? Download the action plan and start saving 95%.”
Very close behind was ad #4 which said, “How to Save 95% on SEO:” and had an engagement rate of 0.51%. I expected this ad to win simply because it was short and to the point.
It’s very interesting that ad #1, “How to Save 95% on SEO. Get the Action Plan here:” was just an extension of ad #4, and yet it was the worst performing ad of the 5. It checked in with an engagement rate of 0.27% which was less than half that of the winning ad.
The overall ranking results were as follows:
- #2 — Paying too much for SEO? Not getting results? Download the action plan and start saving 95%.
- #4 — How to Save 95% on SEO:
- #3 — Paying too much for SEO? Not getting results? Download the action plan. Save 95% compared to SEO services.
- #5 — Avoiding SEO because the cost is too high? Here’s how to get started and save 95% compared to SEO providers.
- #1 — How to Save 95% on SEO. Get the Action Plan here:
Here’s the other interesting thing… The better the conversion rate, the lower the Cost Per Engagement. Ad #2, the best performing, cost 37 cents per engagement while ad #1, the worst performing, cost 89 cents per engagement.
Unfortunately, Twitter ran ad #1 much more than any other ad, nearly twice as often as ad #2. That means my worst performing ad cost nearly half the budget at $21.30. Ad #2, which had 1 more engagement than ad #1, cost a total of $9.31.
Granted, this is a single advertising campaign, but it sure looks like Twitter maximized their own revenue by running the ad with the highest cost per engagement significantly more than the other ads.
How About Statistical Significance?
Which of these ads performed so poorly that I can drop them? Twitter provides the engagement rates so that I can see which ads had higher percentage of engagement.
However, that’s not enough information by itself to decide whether an ad over- or under-performs. An ad could have simply performed poorly in the moment.
I want to know how confident I can be that the results are accurate. For this I use a split testing tool to calculate the confidence.
The best performing ad was shown 4,437 times and had 25 engagements (24 clicks and 1 follow). The worst performing ad was shown 8,768 times and had 24 engagements. Here are the results of the split test calculator:
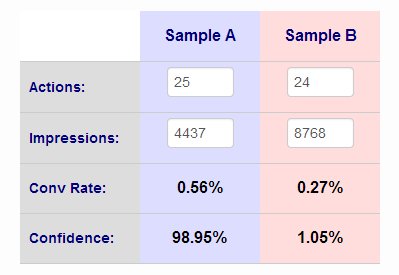
We can see that there is 98.95% confidence that our winning ad was truly better than the losing ad. Actually these results mean that there is a 1.05% chance that we’re wrong. If we were to let the ad run to infinity, there is still a 1% possibility that the losing ad will regain the lead.
Generally, any confidence above 95% is acceptable. It means we’re wrong less than 1 time in 20. That’s good enough for me, so I am throwing away the loser.
The ad that came in fourth place was shown 2,575 times and had 9 engagements. If I check the confidence against the winner, the margin of victory is not quite significant enough by normal standards.
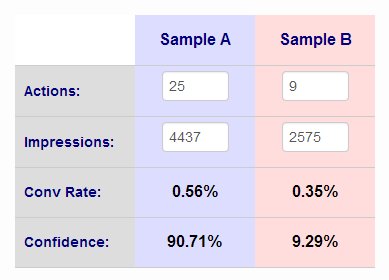
There’s almost a 1 in 10 chance that Sample B could really be the stronger ad. However, I going to eliminate this one anyway. I’m going to accept the 90% confidence because I only want to continue with 3 ads. I find this acceptable because the cost per engagement on this ad is higher too.
What’s Next?
In the end, here are the ads that will move on to the next round of testing:
- Paying too much for SEO? Not getting results? Download the action plan and start saving 95%. bit.ly/UcGbHq
- How to Save 95% on SEO: bit.ly/UcGbHq
- Paying too much for SEO? Not getting results? Download the action plan. Save 95% compared to SEO services. bit.ly/UcGbHq
As I mentioned in the previous post, I am also going to trim down the audience size. Besides data on the ad performance, Twitter also provides data on the audiences.
For example, I see that followers of @FoxBusiness had an engagement rate of 0.54%, which is pretty good, but they were costly at 96 cents per engagement. That was the highest. I will eliminate this source and the others that are too high.
(Note that if these higher priced engagements resulted in better conversion rates with my business, I would not eliminate them. In this case, they cost more without generating more revenue. They can be dropped as I work to optimize revenue.)
I expect that as a result of these changes, my campaign will have to run longer to achieve high confidence values, but I don’t expect the cost to go up. Ideally the overall engagement rate should go up, and the cost per engagement should go down.
Do you have any thoughts on this?
Click here to continue with part 3.